US Ag GHG Emissions Fall to
Lowest Level in 10 years
New EPA Inventory Shows Ag as a Bright Spot
Farmers and ranchers across America are leading the change in reducing emissions, using strategies such as voluntary conservation efforts, dairy methane reduction strategies, and market-based incentives. The Environmental Protection Agency (EPA) recently released the Inventory of U.S. Greenhouse Gas Emissions and Sinks: 1990-2022. The inventory shows American agriculture reduced emissions by almost 2% from 2021-2022, the largest decrease of any economic sector.
From Data Highlights (page 6) of the Inventory of U.S. Greenhouse Gas Emissions and Sinks: 1990-2022
Agriculture:
Agriculture accounted for about 10% of U.S. greenhouse gas emissions in 2022. This includes sources such as livestock enteric fermentation and manure management, N2O emitted from managed agricultural soils from fertilizers and other management practices, and fossil fuel combustion from agricultural equipment. Indirect emissions from electricity in the agricultural sector are about 5% of sector emissions. In 2022, agricultural soil management was the largest source of N2O emissions, and enteric fermentation was the largest source of CH4 emissions in the United States.
The national news further affirms California agriculture’s emissions reduction trends.
Scroll to Read More.
California Ag Emissions Continue Steady Decline
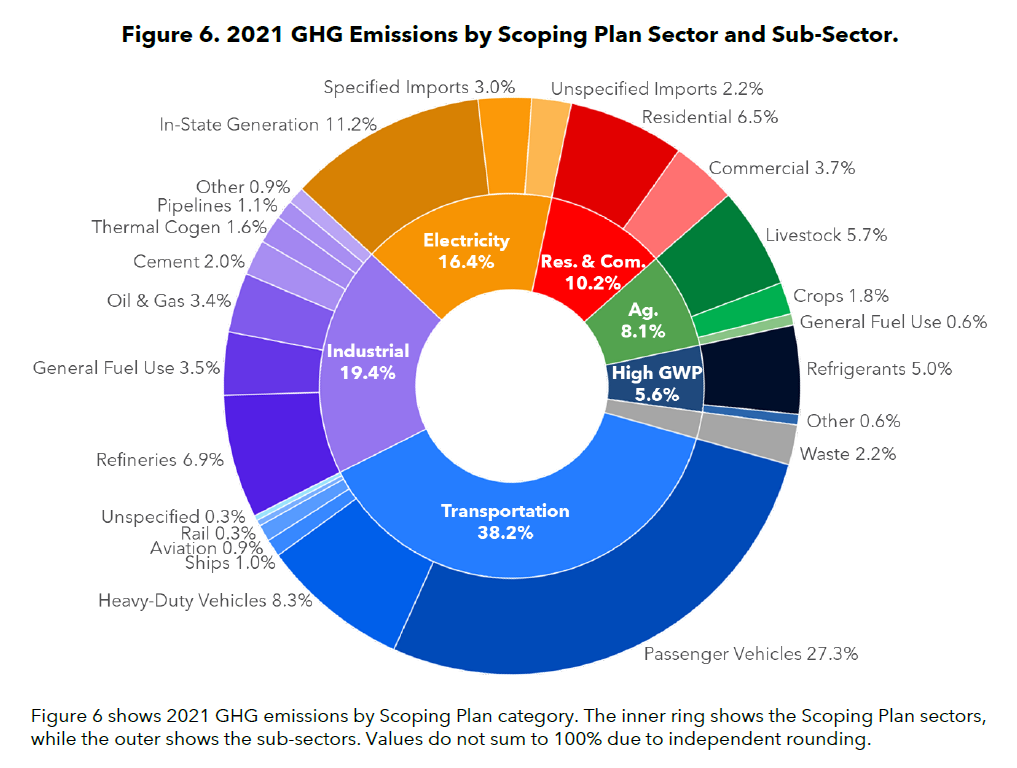
Agriculture sector emissions accounted for 8.1% of California’s total GHG emissions and decreased 0.7 MMTC02e (2.1%) from 2020 to 2021, mostly due to reductions in livestock methane emissions.
Agricultural emissions were one of the few bright spots in the recently released 2021 GHG Inventory. Overall, California's GHG Emissions increased 12.6 MMTCO2e (3.4%) from 2020 to 2021. The increase in overall emissions was due in large part to the Covid-19 pandemic and subsequent economic revitalization.
The transportation (7.4%), electricity (4.8%), and industrial (0.9%) sectors all saw increases from 2020 levels. Agriculture's 2.1% decrease in 2021 is part of a continuing trend of emissions reductions being driven by the state's dairy sector. California's dairy sector is accounting for 22.6% of all reductions produced by the state's climate investment portfolio. As more projects are funded and implemented, these reductions will continue to expand.
From the CARB Inventory, Pages 29-30:
California Agriculture
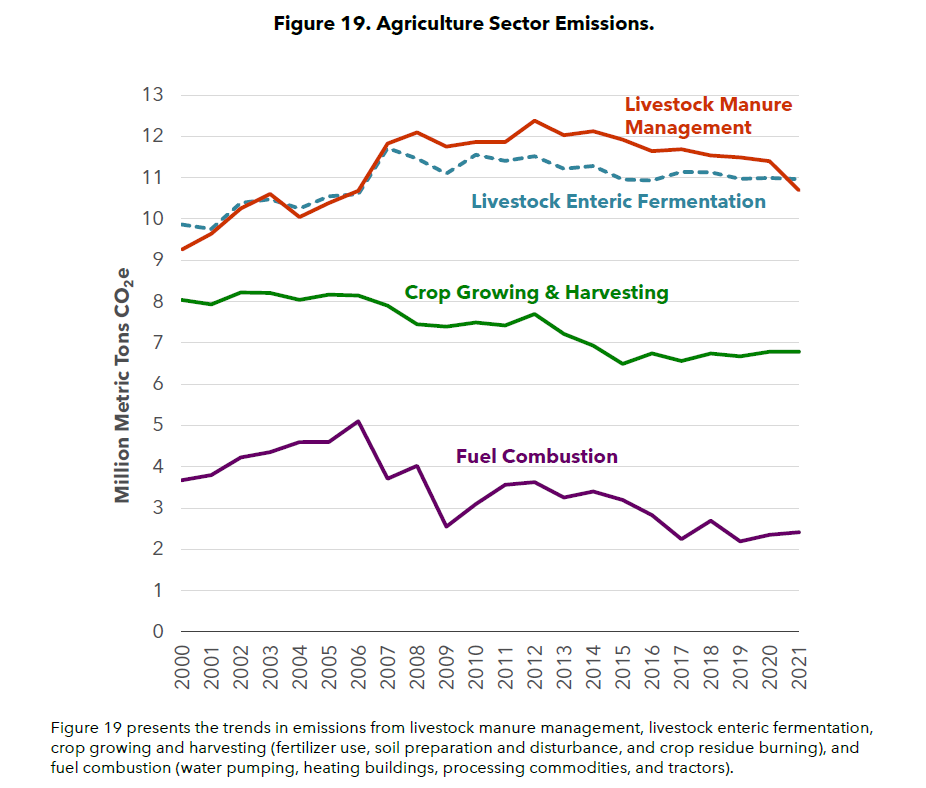
California’s agricultural sector contributed 8.1% of statewide GHG emissions in 2021, mainly from CH4 and N2O sources. Major emissions sources in the agricultural sector include enteric fermentation and manure management from livestock, crop production (fertilizer use, soil preparation and disturbance, and crop residue burning), and fuel combustion (water pumping, heating buildings, processing commodities, and tractors).
Approximately 70% of agricultural sector GHGs are emitted from livestock. Livestock emissions peaked in 2012 at 23.9 MMTCO2e and have decreased by 2.2 MMTCO2e (9.4%) to 21.7 MMTCO2e as of 2021. Livestock emissions are almost entirely CH4 generated from enteric fermentation and manure management, and most of the livestock emissions are from dairy operations. Dairy population followed a generally increasing trend between 2000 and 2012, and GHG emissions from dairy manure management and enteric fermentation followed a similar trend as dairy herd sizes grew over this time. After 2012, methane emissions from dairy operations in California began to decline in proportion to population decreases. Beginning in 2015, California dairy operations increasingly began implementing anaerobic digesters as part of their manure management strategy in response to increased State incentives. Anaerobic digesters process manure in a closed environment, capturing CH4 that would otherwise be emitted to the atmosphere from manure treatment and storage in open lagoons. As of 2021, over 60 anaerobic digesters were operational and managed at least 8.9% of the statewide dairy population’s manure.
Crop production accounted for 22.0% of agriculture sector emissions in 2021. Emissions from the growing and harvesting of crops have generally declined since 2000. The long-term trend of emissions reduction from 2000 to 2021 corresponds to a reduction in crop acreage [22] (which leads to an associated decrease in synthetic fertilizer use) and a shift away from flood irrigation to sprinkler and drip irrigation. Figure 19 presents emissions from the agriculture sector, broken out by sub-sector. The trend in total agriculture sector emissions is displayed in Figure 5.
Download the Full CA Report:
California Greenhouse Gas Emissions from 2000 to 2021: Trends of Emissions and Other Indicators
Date of Release: December 14, 2023


